Most consumer packaged goods (CPG) teams are not short on retail data. Shipment records, point-of-sale data, distributor reports, retailer information, trade promotion results, and syndicated market data can accumulate quickly.
What is often missing is a repeatable process for transforming all that information into decisions people can actually act on.
Without that process, organizations can collect enormous amounts of information while sales, marketing, trade, and leadership teams continue making decisions based on incomplete reports, manual spreadsheets, or intuition.
Effective retail data analytics changes that equation. By collecting, cleansing, contextualizing, and analyzing retail information consistently, CPG teams can turn raw data into actionable retail insights that help identify opportunities, improve forecasting, strengthen retailer relationships, and make smarter trade decisions.
What Is Retail Data Analytics?
Retail data analytics is the process of collecting, organizing, analyzing, and interpreting information from retailers, distributors, point-of-sale systems, trade programs, and other sources to understand business performance and guide decisions.
For CPG manufacturers and suppliers, retail data analysis can include:
- Store-level sales
- Product velocity
- Retail scan data
- Distributor sales
- Retailer performance
- Product distribution
- Out-of-stock trends
- Trade promotion performance
- Retail program compliance
- Historical sales trends
- Category performance
The objective is not simply to create another report. The objective is to determine what the data means and what action should happen next.
The Difference Between Retail Data and Retail Insights
There is an important difference between having data and having insight.
Consider these examples:
Data: Product distribution is 72%.
Insight: Distribution declined five percentage points compared with the previous quarter, with most of the decline concentrated in one retailer.
Action: Identify the affected stores and determine whether the decline resulted from assortment changes, availability issues, or execution problems.
Another example:
Data: A promotion generated a 12% sales increase.
Insight: Sales increased 12%, but historical performance shows the category normally increases 9% during the same period.
Action: Evaluate whether the incremental lift justified the promotional investment before repeating the program.
This progression from data to insight to action is where retail analytics begins creating measurable business value.
Why More Retail Data Does Not Automatically Mean Better Decisions
CPG companies have access to more information than ever before.
That does not necessarily mean decision-making has become easier.
When information is fragmented across different systems, spreadsheets, reports, distributors, and retailers, employees may spend more time preparing data than analyzing it.
A strong CPG data strategy focuses on making information consistent, comparable, and relevant to the people responsible for taking action.
Common Roadblocks to Actionable Retail Insights
Several problems frequently prevent CPG teams from getting full value from their retail data.
Data Is Siloed Across Different Sources
Retail data may come from distributors, retailer portals, point-of-sale systems, brokers, trade programs, and syndicated data providers.
Each source may use different:
- Product identifiers
- Customer names
- Store identifiers
- Reporting periods
- Geographic definitions
- Category structures
Until those differences are reconciled, comparing performance across sources can be difficult.
Reporting Arrives Too Late
An insight loses value when it arrives after the opportunity has passed.
If a distribution issue occurs this week but is not identified until a monthly or quarterly review, the business may lose several weeks of potential sales before anyone investigates.
More frequent visibility allows teams to identify exceptions earlier.
Dashboards Lack Context
A dashboard might show that distribution is 78%, sales increased 6%, or promotional ROI reached a certain level.
Those numbers need context.
Teams should also be able to determine:
- How the metric compares with the previous period
- How it compares with the same period last year
- Whether the result exceeded or missed a target
- How performance compares across retailers
- Whether the trend is improving or declining
For more on selecting meaningful performance metrics, read What Every CPG KPI Dashboard Should Measure in 2026.
Teams Rely on One-Off Spreadsheet Analysis
Spreadsheets remain useful analytical tools, but repeatedly rebuilding the same analysis creates scalability problems.
If every business question requires someone to download multiple files, standardize columns, reconcile accounts, create formulas, and rebuild charts, valuable employee time is spent preparing information instead of using it.
The process also becomes difficult to reproduce consistently across customers and reporting periods.
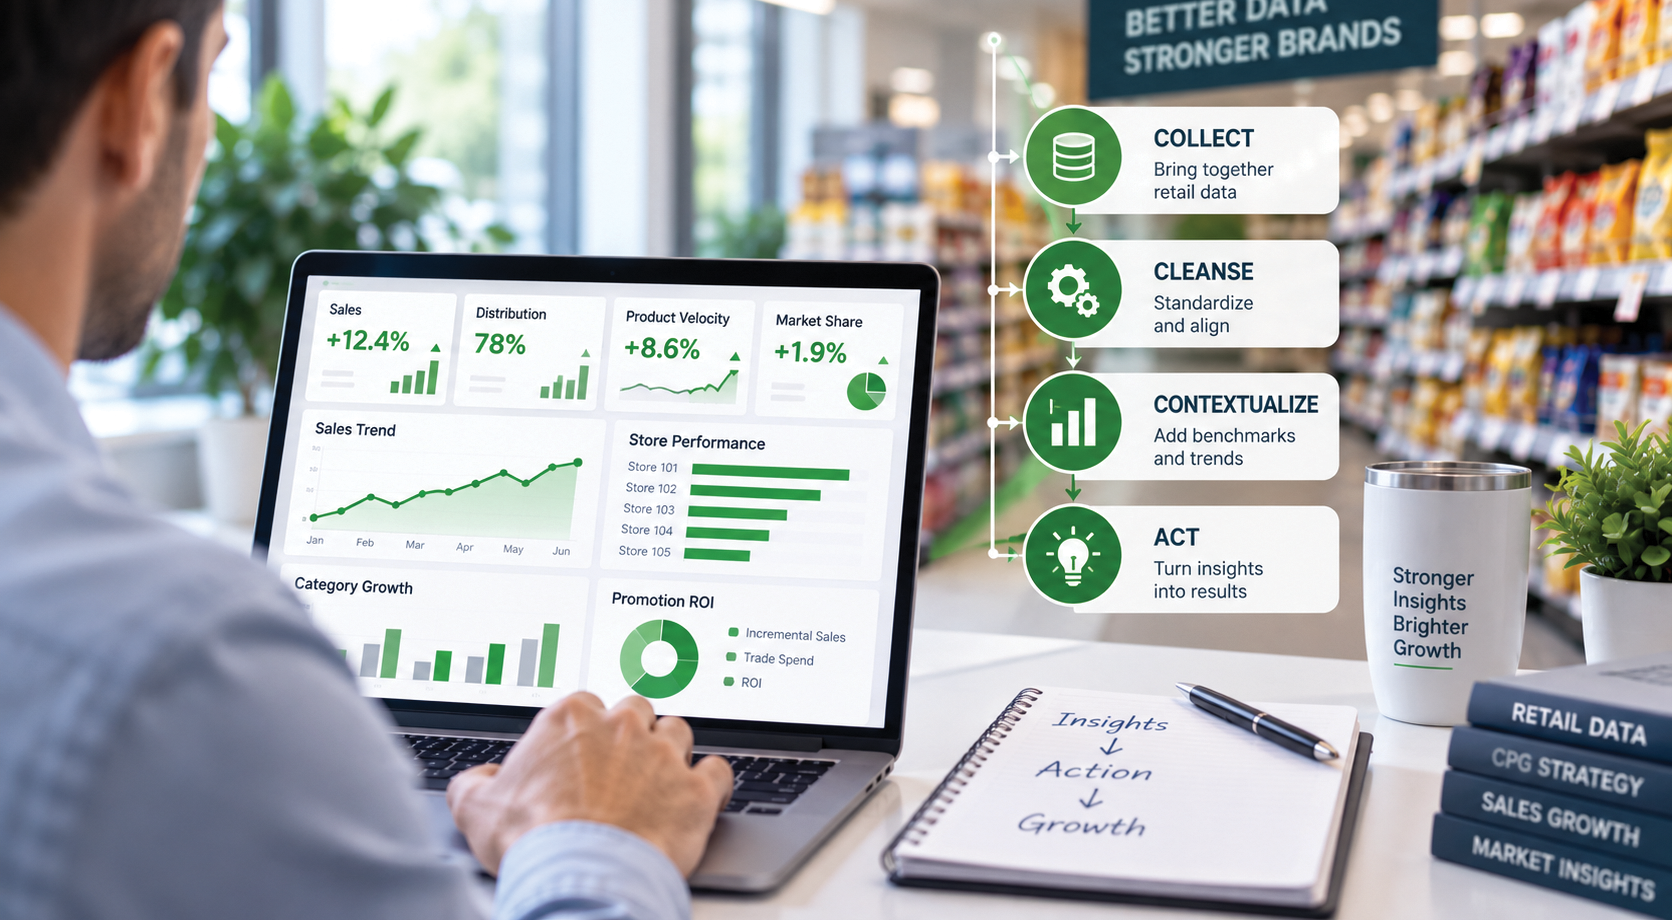
A Practical Framework: Collect, Cleanse, Contextualize, Act
A useful retail data analytics process can be organized into four stages:
Collect. Cleanse. Contextualize. Act.
Each stage plays an important role in transforming raw retail information into actionable insights.
Step 1: Collect the Right Retail Data
The first step is bringing relevant information together.
Depending on the organization, that may include:
- Retail scan data
- Distributor sales data
- Shipment information
- Retailer sales data
- Trade promotion data
- Program compliance information
- Historical sales
- Product and customer master data
The goal should not be collecting every available data point.
Focus on information that supports actual business questions.
For example, if the objective is identifying distribution opportunities, store-level sales and product distribution information may be significantly more valuable than high-level national sales totals.
Step 2: Cleanse and Standardize the Data
Raw retail data rarely arrives in a perfectly consistent format.
One retailer might identify a product using a UPC while another uses an internal item number. Distributor names may appear differently across reports. Reporting calendars may use different weekly periods.
Data cleansing helps standardize:
- SKUs
- UPCs
- Retailer names
- Distributor names
- Store locations
- Time periods
- Geographic markets
- Product categories
This step is essential because unreliable inputs create unreliable analysis.
Step 3: Add Context to Retail Data
Once the information is consistent, it needs context.
A number by itself rarely tells the entire story.
Useful context can include:
- Prior-period performance
- Year-over-year comparisons
- Historical averages
- Targets
- Retailer benchmarks
- Distributor comparisons
- Regional performance
- Promotional baselines
This allows teams to determine whether a result represents strong performance, normal variation, or an issue requiring attention.
Step 4: Connect the Insight to an Action
This is the step that ultimately determines whether retail analytics creates value.
Every meaningful insight should lead to a potential decision or action.
For example:
| Retail Insight | Potential Action |
|---|---|
| Product velocity is strong but distribution is low | Identify similar stores for potential distribution expansion |
| Sales declined sharply at specific locations | Investigate availability or execution issues |
| A promotion generated weak incremental lift | Review the program before renewing the investment |
| One distributor is outperforming comparable territories | Identify practices that could be replicated elsewhere |
| Retail program compliance is declining | Identify retailers or stores requiring follow-up |
The best retail analytics does not simply describe the business. It helps teams decide what to do next.
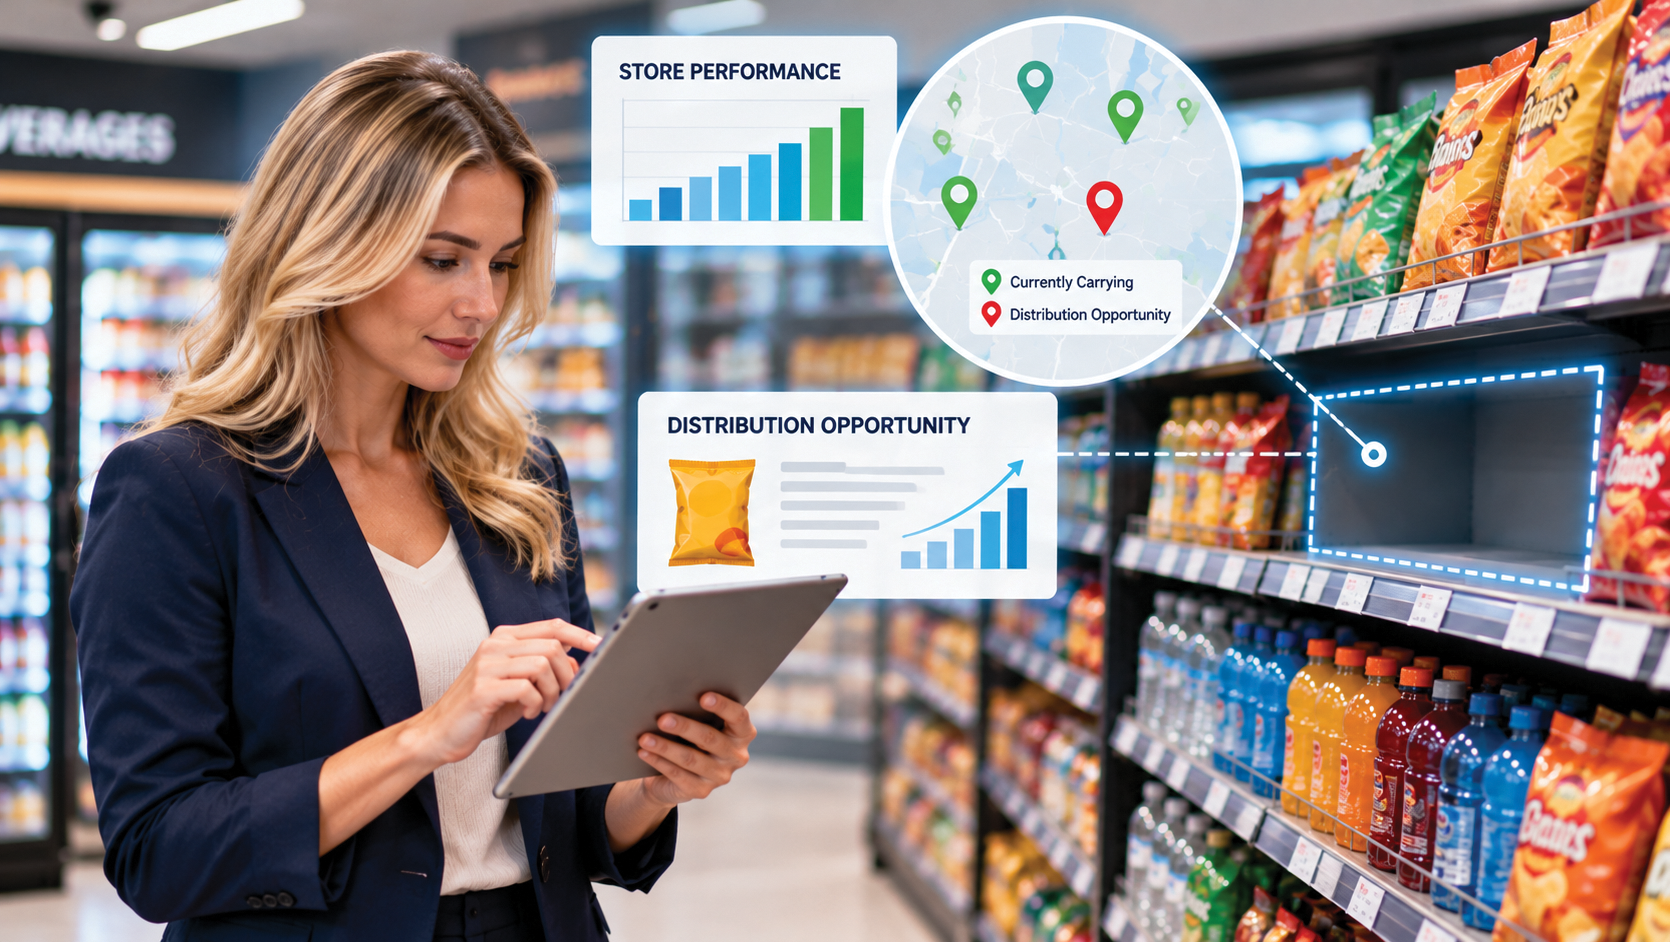
Use Store-Level Data to Find Opportunities Hidden by Averages
Aggregate reporting is useful for understanding overall performance, but averages can hide important differences.
Suppose a product is growing 8% across a retail chain.
That appears positive.
Store-level analysis might reveal that growth is concentrated in only 40% of locations, while another group of stores has declining sales or no product distribution at all.
Those differences can reveal:
- Product voids
- Distribution opportunities
- Potential out-of-stock conditions
- Regional trends
- High-performing locations
- Underperforming stores
Store-level visibility makes retail data more actionable because teams can identify exactly where an opportunity or problem exists.
See How CPG Manufacturers Can Improve Operational Visibility in 2026 for additional examples.
Turn Retail Data Into Better Trade Decisions
Retail data analytics also plays an important role in trade promotion and trade spend decisions.
Instead of evaluating a promotion only by total sales, CPG teams can connect trade investments with:
- Retail execution
- Store participation
- Sales lift
- Incremental volume
- Product availability
- Trade program compliance
- Historical performance
- Promotional ROI
This gives teams a more defensible basis for determining which programs should be repeated, modified, or discontinued.
Learn more in The Hidden Cost of Poor Trade Spend Visibility.
Use Historical Retail Data to Improve Forecasting
Current retail data tells teams what is happening today. Historical data helps explain whether the current pattern is meaningful.
Analyzing historical retail information can reveal:
- Seasonal purchasing patterns
- Recurring category trends
- Product lifecycle changes
- Promotion performance patterns
- Retailer growth trends
- Distributor performance changes
Historical context can also improve forecasting by helping teams distinguish recurring demand patterns from unusual short-term events.
How Actionable Insights Strengthen Retailer Relationships
Retail analytics is not only an internal reporting function.
It can also improve conversations with retailers and distributors.
Instead of approaching a retailer with a general request for additional distribution, a CPG supplier can bring evidence showing:
- How the product performs in comparable stores
- Where distribution gaps exist
- How the category is trending
- What previous promotions delivered
- Which locations represent potential opportunities
This creates a more strategic conversation focused on measurable growth.
Read How CPG Suppliers Can Improve Retailer Relationships in 2026 for more on data-driven collaboration.
The Case for a Unified Retail Analytics Process
Manually repeating the collect, cleanse, contextualize, and analyze process for every retailer or distributor becomes difficult to scale.
A unified analytics approach can automate much of the repetitive preparation required before analysis begins.
Instead of spending time:
- Downloading files
- Matching product identifiers
- Reconciling customer names
- Standardizing reporting periods
- Combining spreadsheets
- Rebuilding recurring reports
sales, marketing, finance, and trade teams can spend more time interpreting results and deciding what actions to take.
What Makes a Retail Insight Actionable?
An actionable insight should generally answer four questions:
- What happened?
- Why does it matter?
- Where is it happening?
- What should we investigate or do next?
For example:
What happened? Distribution declined 6%.
Why does it matter? The decline corresponds with lower sales in a high-value market.
Where is it happening? The majority of lost distribution occurred across 35 stores within one retailer.
What happens next? The account team investigates assortment, availability, and retailer execution at those locations.
This is significantly more useful than a dashboard that simply reports “Distribution: 74%.”
Best Practices for a Strong CPG Data Strategy
Start With Business Questions
Define the decisions teams need to make before determining which metrics to track.
Standardize Important Data
Consistent product, customer, store, and time-period definitions make comparisons more reliable.
Add Benchmarks to Every Important KPI
Show whether performance is improving, declining, meeting expectations, or falling behind.
Make Insights Specific
Identify the product, retailer, distributor, store, region, or program responsible for the change whenever possible.
Deliver Information Frequently
Insights should reach decision-makers while there is still time to act.
Prioritize Exceptions
Teams should not have to inspect every metric manually. Highlight unusual changes and opportunities that deserve attention.
Connect Reporting to Decisions
Measure success based on whether analytics improves actions and outcomes, not simply how many dashboards are produced.
From More Data to Better Decisions
Retail data has never been more abundant.
The CPG teams that gain the greatest advantage will not necessarily be the organizations with the largest datasets. They will be the teams that have built a reliable process for turning information into decisions.
Collecting the data is only the beginning.
Cleanse it so it can be trusted. Contextualize it so the numbers have meaning. Deliver it to the people responsible for taking action. Then measure what happens next.
That is how retail data analytics moves from reporting to business impact.
InfoBate automates the collect, cleanse, and contextualize process for CPG teams, delivering retail insights that are ready to act on instead of simply providing another report to interpret.
Explore additional articles on retail analytics, CPG business intelligence, trade programs, and data-driven decision-making in the InfoBate News Center.
Frequently Asked Questions About Retail Data Analytics
What is retail data analytics?
Retail data analytics is the process of collecting, organizing, and analyzing data from retailers, distributors, point-of-sale systems, and other sources to understand product performance and guide sales, marketing, trade, and planning decisions.
Why doesn’t more retail data always lead to better decisions?
Data becomes useful when it is consolidated, cleansed, and placed in context using benchmarks, trends, or targets. Without that process, raw information may remain unused or require time-consuming manual analysis before teams can interpret it.
What is the fastest way to make retail data more actionable?
Automating the process of combining and standardizing data sources, then comparing performance against meaningful benchmarks, can significantly reduce the time between receiving information and identifying an action.
What types of retail data should CPG teams analyze?
Useful sources include retail scan data, distributor sales, store-level sales, product distribution, trade promotion performance, retailer compliance, historical sales, category data, and product velocity.
What are actionable retail insights?
Actionable retail insights explain not only what happened, but why the result matters, where the opportunity or problem exists, and what action a sales, marketing, trade, or management team should consider next.
How can retail data analytics improve sales?
Retail analytics can help identify distribution gaps, product voids, high-performing stores, underperforming locations, product availability issues, retailer opportunities, and sales trends that require attention.
How does retail data analytics support trade promotion decisions?
Retail analytics allows CPG teams to connect promotional investments with execution, sales lift, incremental volume, retailer participation, compliance, and ROI, creating a stronger basis for future trade decisions.
How can retail data improve forecasting?
Historical retail data helps teams identify seasonal patterns, recurring demand trends, product lifecycle changes, retailer performance patterns, and other signals that can improve forecasting assumptions.