For consumer packaged goods (CPG) manufacturers and suppliers, growing sales is not always about launching new products or increasing promotional spending. Sometimes, the greatest opportunities are already hiding within existing retail networks.
A product may be performing exceptionally well in one group of stores while remaining unavailable in similar locations nearby. Another product may have strong consumer demand but limited distribution across a particular retailer, territory, or distributor network.
Without store-level visibility, these opportunities can go unnoticed.
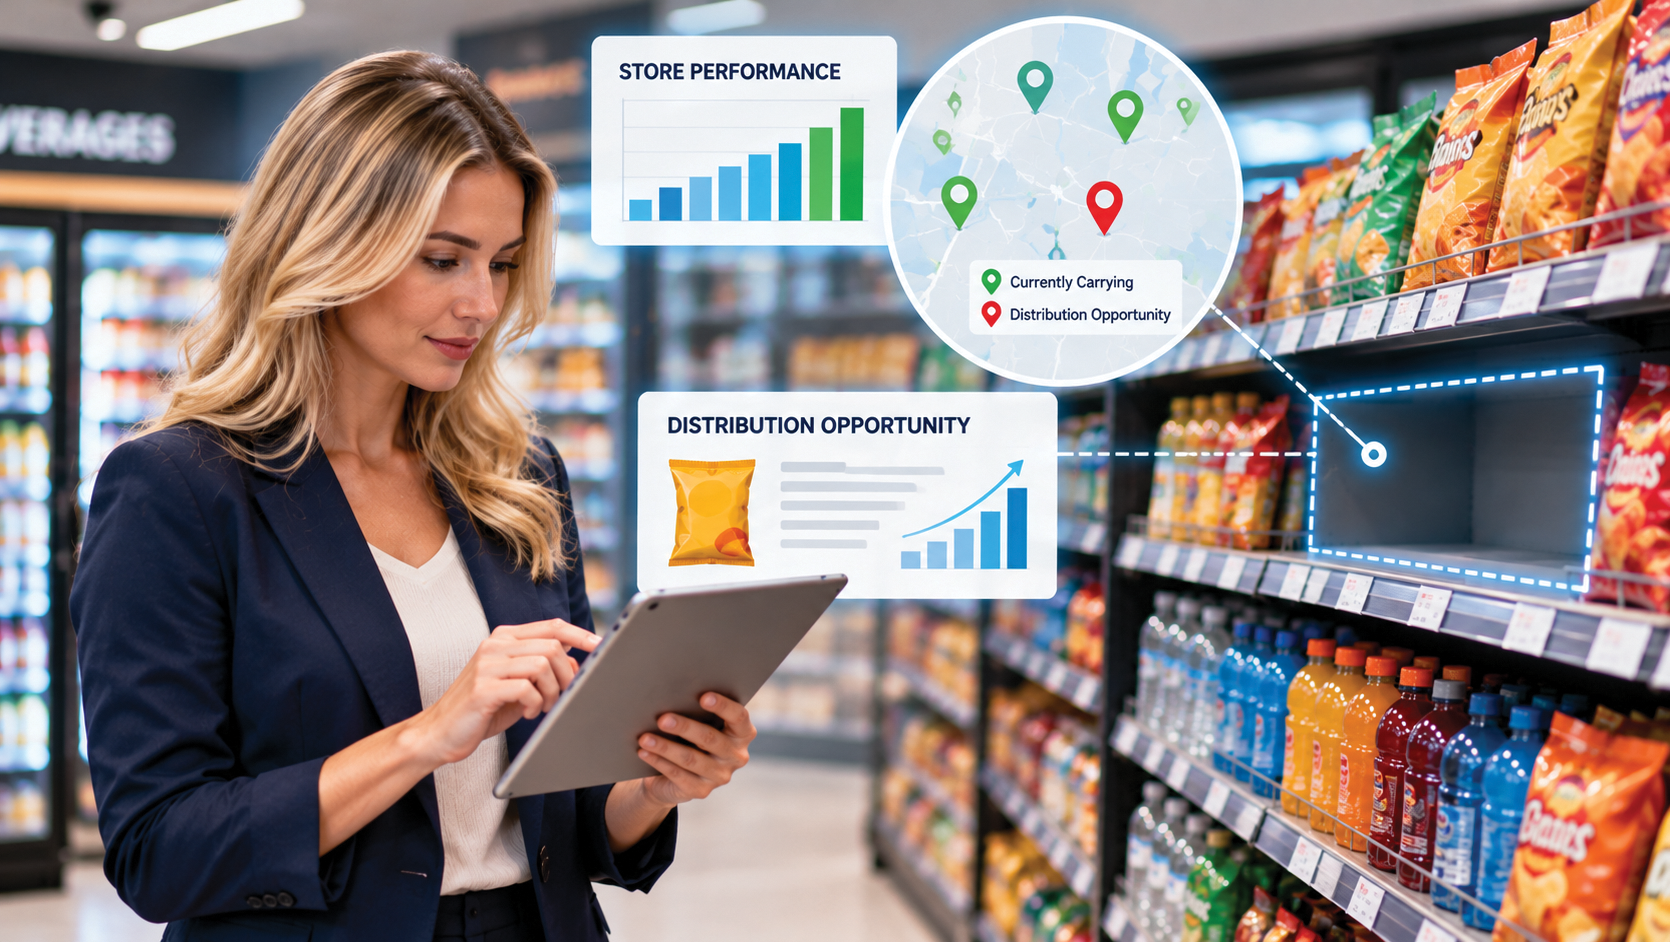
That is why product void analysis is becoming an important part of CPG distribution strategies. By combining retail sales data, distributor information, product performance, and geographic insights, suppliers can identify missing products, prioritize high-potential locations, and make more informed distribution decisions.
What Is a Product Void in CPG Distribution?
A product void occurs when a product is not available or represented in a retail location where it may have an opportunity to generate sales.
For example, imagine a beverage brand that performs strongly in 150 convenience stores across a region. However, another 75 stores within the same retail network do not carry that product.
Those locations may represent potential distribution opportunities, particularly if they share characteristics with the stores where the product already performs well.
Product voids can exist across:
- Individual retail stores
- Convenience store chains
- Distributor territories
- Geographic markets
- Product categories
- Specific SKUs or package sizes
Not every missing product represents a profitable opportunity. Effective product void analysis helps suppliers determine which gaps are worth investigating.
Why Product Void Analysis Matters for CPG Suppliers
Expanding distribution can be an effective way to increase sales without relying exclusively on additional promotions or new product launches.
However, broad distribution expansion can consume significant resources when opportunities are not properly prioritized.
A data-driven approach helps suppliers focus on locations where there is stronger evidence of potential demand.
Benefits can include:
- Identifying untapped sales opportunities
- Improving retailer coverage
- Prioritizing high-potential stores
- Supporting category management discussions
- Strengthening distributor relationships
- Improving product availability
- Making more efficient use of sales resources
For additional insights into distribution planning, read The Future of Convenience Store Distribution: 7 Trends to Watch.
Step 1: Start With Store-Level Sales Data
Aggregate sales reports provide a useful overview of business performance, but they can hide important differences between individual retail locations.
A product might generate strong sales across a retail chain while performing very differently from one store to another.
Store-level sales data helps CPG suppliers understand:
- Which locations currently sell the product
- Where product velocity is strongest
- Which stores are underperforming
- Where sales have declined unexpectedly
- Which stores may represent distribution opportunities
For example, if a product consistently performs well in urban convenience stores with similar customer demographics, suppliers can investigate comparable stores where that product is not currently available.
This creates a more targeted approach to distribution expansion.
Step 2: Compare Product Distribution Across Similar Stores
Not every convenience store, retailer, or geographic market has the same customer base.
Comparing stores with similar characteristics can help suppliers identify distribution gaps with greater confidence.
Useful comparison factors include:
- Geographic location
- Store format
- Retailer type
- Category performance
- Historical purchasing patterns
- Product velocity
- Store sales volume
If a product performs strongly in one group of comparable stores but is missing from another, the missing locations may warrant further investigation.
However, suppliers should also consider local demand, retailer assortment policies, shelf capacity, and distribution restrictions before recommending expansion.
Step 3: Identify Distribution Gaps by Retailer and Distributor
CPG suppliers frequently work with multiple retailers and distributors across different territories.
Distribution opportunities may be concentrated within a particular retailer, distributor network, or geographic region.
Analyzing distribution by partner helps answer questions such as:
- Which distributors have the strongest product coverage?
- Where are similar retailers carrying different assortments?
- Which territories have lower distribution than expected?
- Where are successful products underrepresented?
- Which accounts have the greatest expansion potential?
These insights can support more productive conversations with distributor sales representatives and retail account managers.
Rather than requesting broad distribution expansion, suppliers can present specific opportunities supported by actual retail performance.
Step 4: Distinguish Product Voids From Out-of-Stock Situations
One important distinction is the difference between a product void and an out-of-stock condition.
Product void: A product is not part of a store’s current assortment or authorized distribution.
Out-of-stock: A product is normally carried by the store but is temporarily unavailable.
Both situations can affect sales, but they require different actions.
A product void may require a new listing, assortment approval, or distributor coordination.
An out-of-stock condition may require investigation into replenishment, ordering, inventory accuracy, or retail execution.
Sales data alone may not conclusively distinguish between these situations. Suppliers should validate suspected gaps using available assortment, authorization, inventory, order, or field execution information.
Step 5: Prioritize Distribution Opportunities Using Product Velocity
Product velocity measures how quickly a product sells within the stores carrying it.
For CPG suppliers, product velocity can help identify where distribution expansion may produce meaningful results.
Consider two products:
- Product A: Strong distribution but relatively low sales per store.
- Product B: Limited distribution but consistently strong sales per store.
Product B may represent a stronger distribution expansion candidate if comparable stores demonstrate similar demand.
Suppliers can evaluate:
- Units sold per store
- Sales per selling location
- Historical product performance
- Category growth
- Distribution percentage
- Product availability
Combining these metrics provides a more complete picture than evaluating total sales alone.
Step 6: Estimate the Potential Value of Distribution Gaps
Once a distribution opportunity has been identified, suppliers should estimate its potential financial value.
For example, consider a hypothetical product that sells an average of 20 units per week in comparable stores.
If 50 additional stores represent realistic distribution opportunities, the potential incremental unit volume could be estimated as:
50 stores × 20 units per week = 1,000 additional units per week.
Over 52 weeks, that represents a theoretical annual opportunity of 52,000 units.
This is an illustrative estimate, not a sales forecast. Actual performance depends on distribution approval, store characteristics, launch timing, availability, consumer demand, and other factors.
Suppliers should refine estimates using comparable-store performance, expected distribution ramp-up, seasonality, and product margins.
Step 7: Turn Distribution Insights Into Retailer Conversations
Identifying a distribution gap is only the beginning.
The next step is translating that information into a recommendation that retailers and distributors can evaluate.
For example, a supplier might present:
- Current product distribution
- Sales velocity in comparable stores
- Category performance
- Potential distribution opportunities
- Expected incremental sales
- Recommended store locations
- Supporting historical data
This approach changes the conversation from simply requesting additional shelf space to demonstrating why a particular product may create value for the retailer.
Learn more in How CPG Suppliers Can Improve Retailer Relationships in 2026.
Using Retail Data Analytics to Identify Hidden Opportunities
Product void analysis becomes more effective when suppliers connect multiple sources of information.
Useful data sources may include:
- Retail scan data
- Distributor sales reports
- Store-level sales
- Product master data
- Retailer authorization lists
- Historical sales trends
- Category performance
- Field execution reports
By organizing this information consistently, CPG teams can identify patterns that may be difficult to recognize through manual reporting.
For example, an analytics process can highlight products with strong velocity and relatively low distribution, then identify comparable stores where those products are missing.
This helps sales teams focus on actionable opportunities instead of searching through disconnected spreadsheets.
Read Turning Retail Data Into Actionable Insights: A Guide for CPG Teams for a practical framework for making retail information more useful.
Important KPIs for Product Void Analysis
CPG suppliers should monitor several metrics when evaluating distribution opportunities.
- Numeric distribution: The percentage of relevant stores carrying a product.
- Weighted distribution: Distribution measured according to the category sales importance of stores carrying the product.
- Product velocity: Sales volume relative to the stores selling the product.
- Distribution growth: Changes in the number or share of stores carrying the product.
- Store-level sales: Product performance at individual retail locations.
- Category performance: Sales trends within the relevant product category.
- Product availability: Whether authorized products are available for purchase.
- Incremental sales: Additional sales associated with new distribution.
Monitoring these KPIs can help suppliers prioritize distribution opportunities and evaluate the results of expansion efforts.
How Distribution Analysis Supports Trade Program Management
Distribution expansion and trade promotion planning should work together.
A trade promotion may generate limited results when product availability is inconsistent across participating stores.
Conversely, a distribution expansion program may benefit from targeted promotional support when products are introduced into new locations.
CPG teams can connect distribution data with:
- Retailer participation
- Promotional execution
- Product placement
- Sales lift
- Trade spend
- Promotional ROI
This helps suppliers determine whether distribution investments and promotional programs are contributing to measurable growth.
For additional guidance, read Building More Effective Trade Programs: A Practical Guide for CPG Companies.
Common Mistakes to Avoid in Product Void Analysis
Assuming Every Missing Product Is an Opportunity
A product may be absent from a store for valid reasons, including customer preferences, assortment restrictions, or limited shelf capacity.
Using Aggregate Sales Without Store-Level Detail
Chain-wide averages can hide important differences between individual locations.
Confusing Out-of-Stocks With Distribution Voids
A temporary availability issue should not automatically be treated as an assortment opportunity.
Ignoring Product Velocity
Expanding distribution for a slow-moving product may create limited value for the retailer.
Failing to Validate Opportunities
Potential product voids should be confirmed using relevant retailer, distributor, authorization, or field information.
Not Measuring Results After Expansion
Distribution gains should be evaluated against actual sales, product velocity, availability, and profitability.
Best Practices for Building a Data-Driven Distribution Strategy
CPG suppliers can strengthen their distribution planning by following several practical principles.
- Use consistent store and product identifiers across data sources.
- Compare performance across similar retail locations.
- Prioritize products with demonstrated sales velocity.
- Validate suspected voids before recommending expansion.
- Consider retailer and distributor requirements.
- Estimate opportunities using realistic assumptions.
- Track new distribution after implementation.
- Review results regularly and refine future recommendations.
The goal is not simply to maximize the number of stores carrying a product. It is to improve distribution quality and generate sustainable growth.
Turning Product Voids Into Measurable Growth
CPG suppliers do not always need new products or larger promotional budgets to uncover growth opportunities.
Sometimes, the next opportunity is a product already performing well in one store but missing from another.
With the right store-level data, distribution analysis, product velocity metrics, and retailer insights, suppliers can identify those opportunities more effectively.
Product void analysis helps teams move beyond broad sales reporting toward specific, actionable distribution recommendations.
InfoBate helps CPG manufacturers and suppliers analyze store-level sales, retailer performance, distributor activity, and product distribution to identify opportunities and support more informed business decisions.
Learn more about InfoBate’s data analytics and store execution solutions, or explore additional articles in the InfoBate News Center.
Frequently Asked Questions About Product Voids and Distribution Opportunities
What is product void analysis?
Product void analysis is the process of identifying retail locations where a product is missing from the assortment and evaluating whether those locations represent potential sales opportunities.
How can CPG suppliers identify distribution gaps?
CPG suppliers can compare store-level sales, product distribution, retailer assortment information, product velocity, and performance across similar locations to identify stores where products may be underrepresented.
What is the difference between a product void and an out-of-stock?
A product void generally refers to a product that is not carried or authorized in a retail location. An out-of-stock occurs when a product that is normally carried is temporarily unavailable.
Why is store-level sales data important for distribution analysis?
Store-level data reveals differences in product performance and distribution that may be hidden by chain-wide or regional sales totals. This helps suppliers identify specific locations worth investigating.
How can suppliers estimate distribution opportunities?
Suppliers can compare product velocity in similar stores, identify realistic placement opportunities, and estimate potential incremental unit sales while accounting for store differences, availability, and expected distribution timing.
What KPIs should CPG suppliers track?
Important KPIs include numeric distribution, weighted distribution, product velocity, store-level sales, distribution growth, product availability, category performance, and incremental sales.
How does product void analysis improve retailer relationships?
Product void analysis allows suppliers to present data-supported distribution recommendations, helping retailers evaluate potential category growth and product assortment opportunities.
How can business intelligence improve distribution planning?
Business intelligence helps organize sales, distribution, retailer, and historical performance information so CPG teams can identify patterns, prioritize opportunities, and monitor the results of distribution expansion.